
On-chain data shows the Bitcoin whales have been dialing back risk on derivatives exchanges following the latest downturn in the cryptocurrency.
Bitcoin Inter-Exchange Flow Pulse Has Just Turned Red
As explained by CryptoQuant founder and CEO Ki Young Ju in a new Inter-Exchange Flow Pulse (IFP) is an indicator that tracks the BTC movements between spot and derivatives exchanges.
When the value of this metric rises, the amount of cryptocurrency going from spot to derivatives platforms goes up. Such a trend implies that large entities like the whales are potentially looking to open up new positions in the derivatives market.
On the other hand, a decline in the indicator suggests investors are transferring fewer coins to the derivatives exchanges. This trend could signal a decreasing appetite for risk positions in the sector.
Now, here is a chart that shows the trend in the Bitcoin IFP, as well as its 90-day simple moving average (SMA), over the past decade:
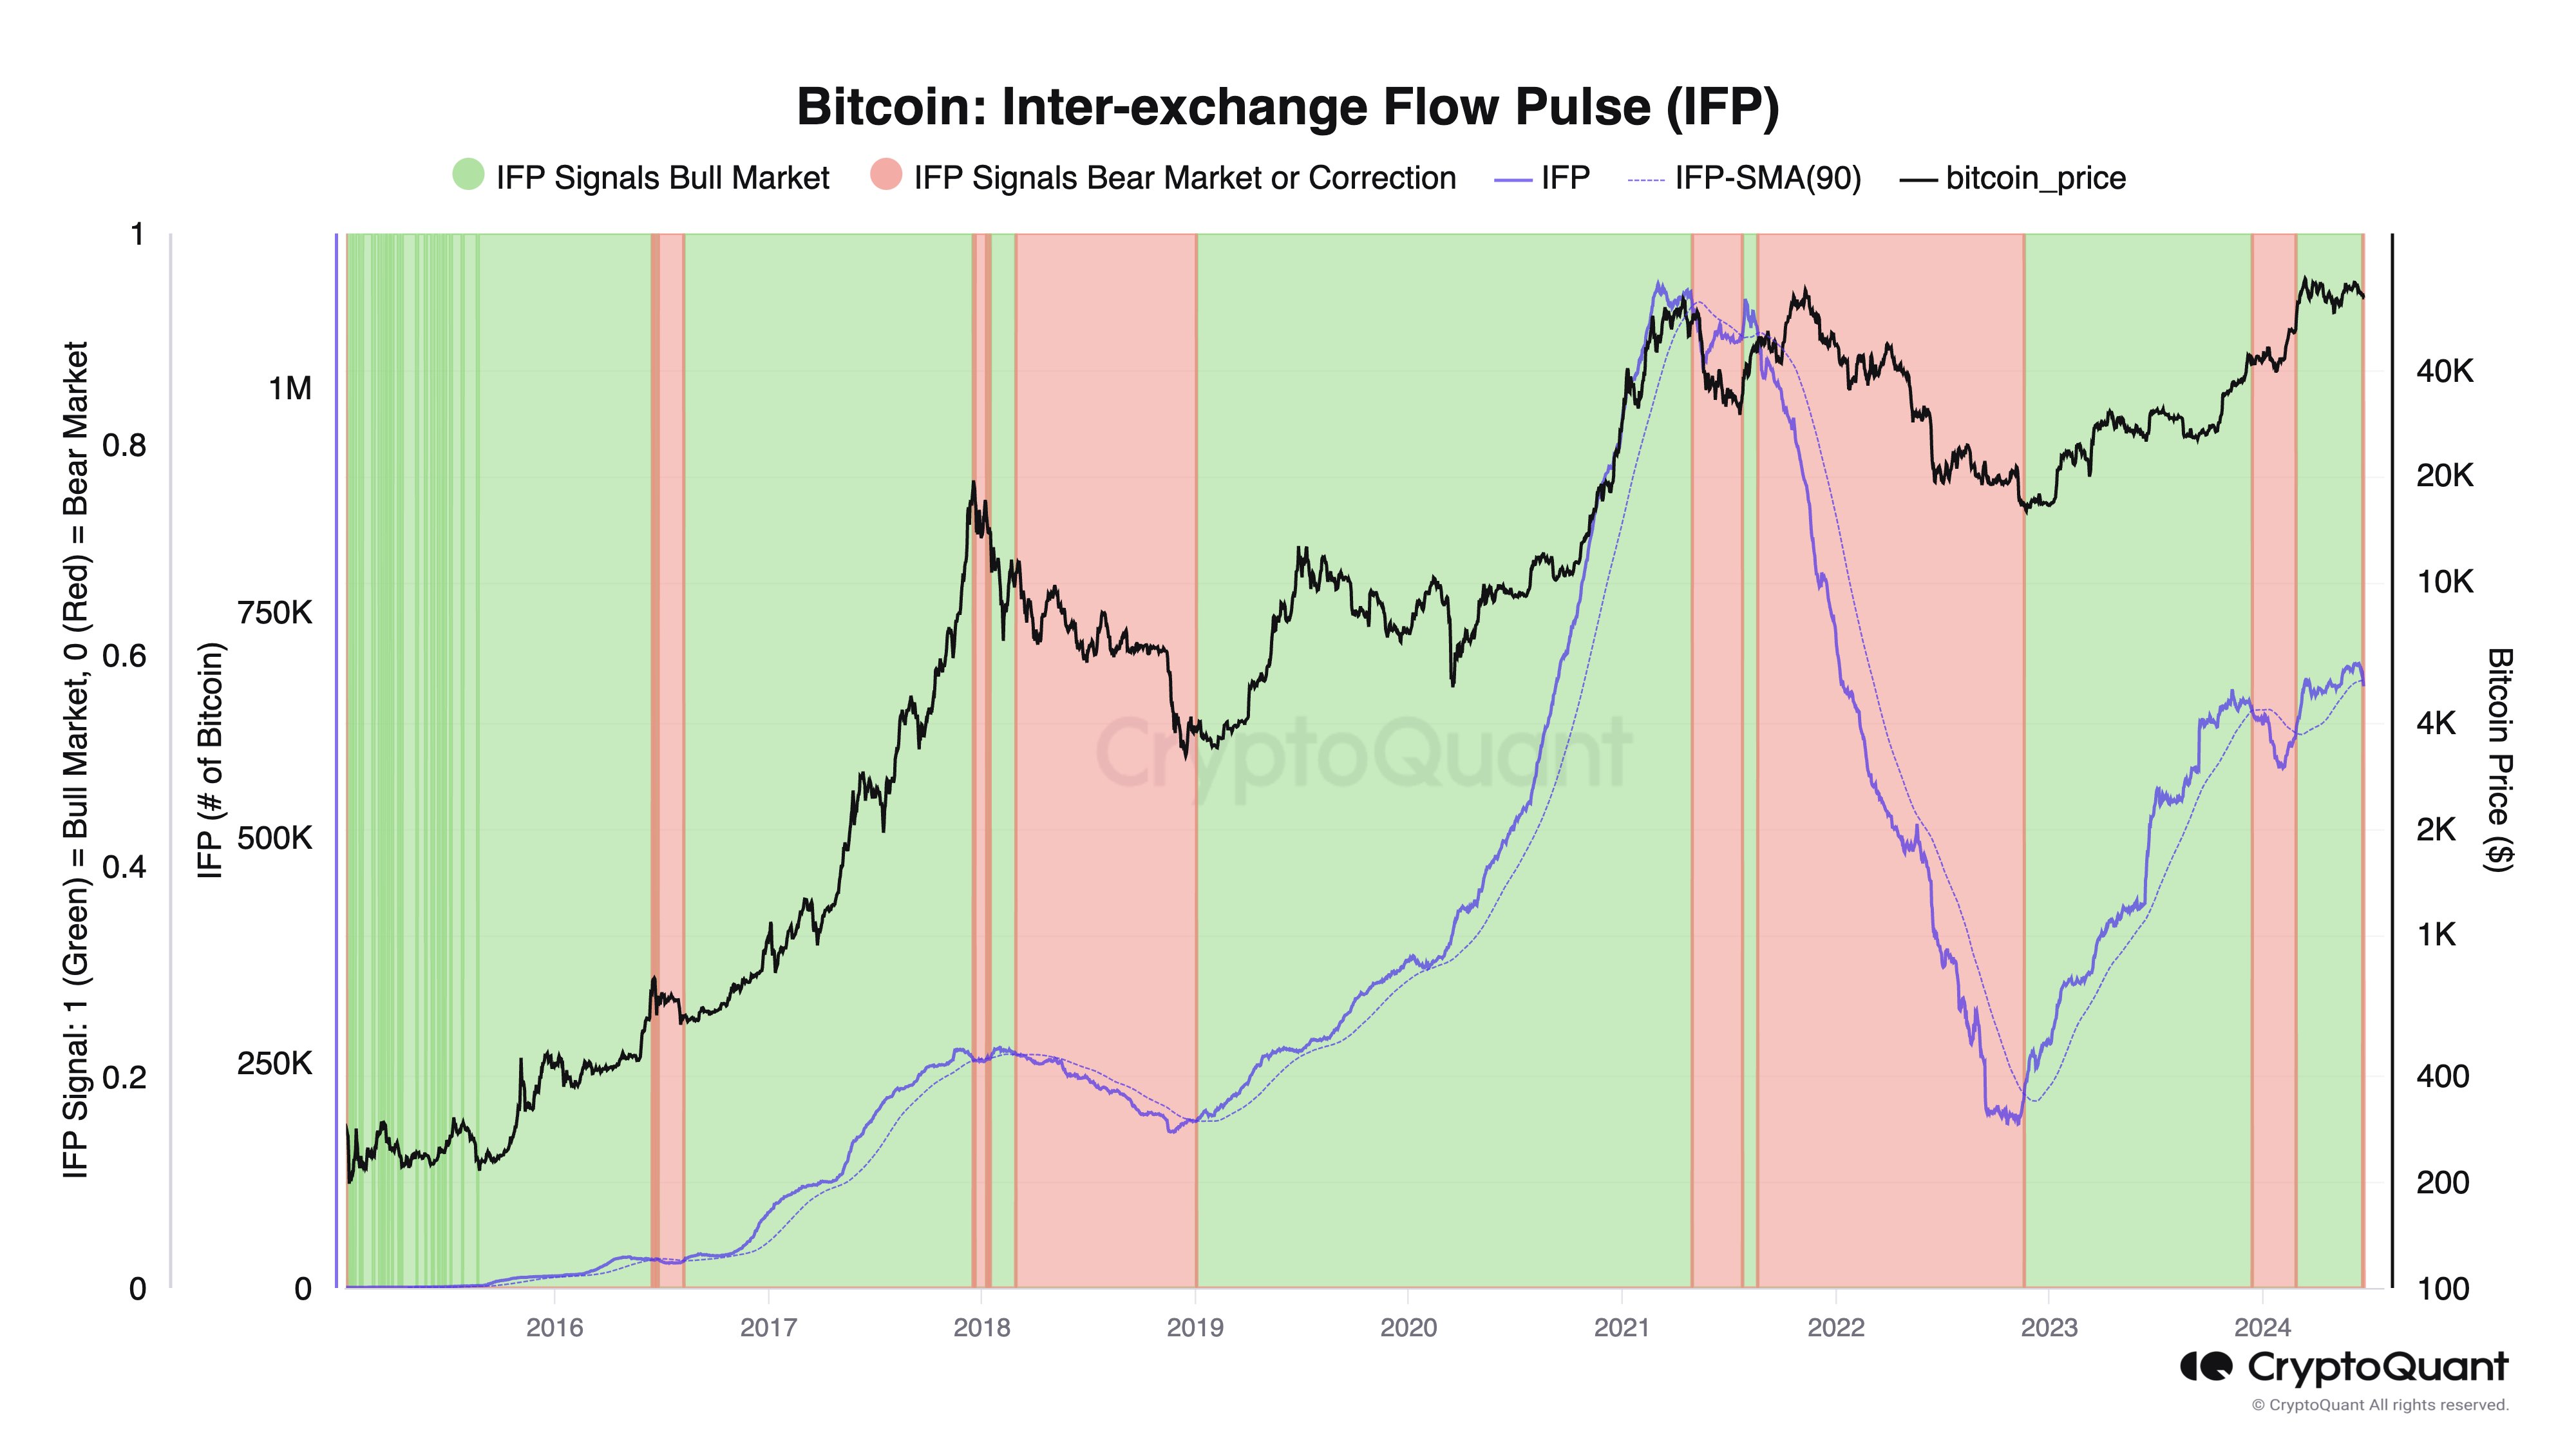
As displayed in the above graph, the Bitcoin IFP had been climbing earlier, but the metric seems to have reversed its direction recently, as it’s now heading down instead. Following the latest decline, the indicator has crossed below its 90-day SMA.
Historically, the IFP observing a cross with its 90-day SMA has signified a market sentiment shift. A breakout above this line suggests the whales are willing to take risks with the asset again, which can potentially be a bullish signal.
The chart shows that such a cross occurred around both the 2018 and 2022 bear market lows. On the other hand, a plunge under the 90-day SMA usually takes place near tops, as it implies the whales are looking at derivative positions as too risky.
As the indicator has once more seen the latter type of crossover, it’s possible that the asset could end up facing some bearish momentum. This possible shift to a bearish sentiment, however, doesn’t have to last for too long.
The previous instance of the IFP dropping below its 90-day SMA in January. This crossover coincided with Bitcoin’s downturn following the spot exchange-traded fund (ETF) approval.
The bearish momentum ended up only temporary, though, as the cryptocurrency soon found a breakout that led to its new all-time high (ATH). The asset observed only a temporary effect from this crossover in 2016 before catching back an uptrend into the 2017 bull run.
It remains to be seen where this bearish Bitcoin IFP crossover will lead to this time.
BTC Price
Bitcoin hasn’t seen an end to its recent decline, as its price has now dropped to $61,200.